Key advances: global zooplankton imaging, dispersal barriers, evolutionary diversification
Zooplankton form the macroscopic link between microbial food webs and higher trophic levels and play a critical role in carbon transfer. Tara Oceans collected an unprecedented, globally standardized zooplankton dataset using multiple net systems across depth layers. Imaging and molecular analyses revealed patterns of biodiversity, dispersal limitation, and evolutionary diversification shaped by ocean circulation and historical climate change (Tara Oceans publication numbers 38, 123, 145, 158).
These data have highlighted strong biogeographic barriers, the ecological consequences of oxygen minimum zones, and the deep evolutionary roots of major zooplankton lineages (Tara Oceans publication numbers 19, 56, 121, 124, 136), while underscoring the vast, still‑underexploited potential of the Tara Oceans zooplankton collection.
Figure 6. Zooplankton automated imaging strategy. Upper panel. The suite of automated imaging workflows implemented in Tara Oceans, from Flow-Cytometry to Underwater Video Profiler (UVP), are generating millions of single plankton images from <1μm to a few cm. Single organisms’ images are stored and organized online via the expert-annotation platform EcoTaxa (http://ecotaxa.sb-roscoff.fr).
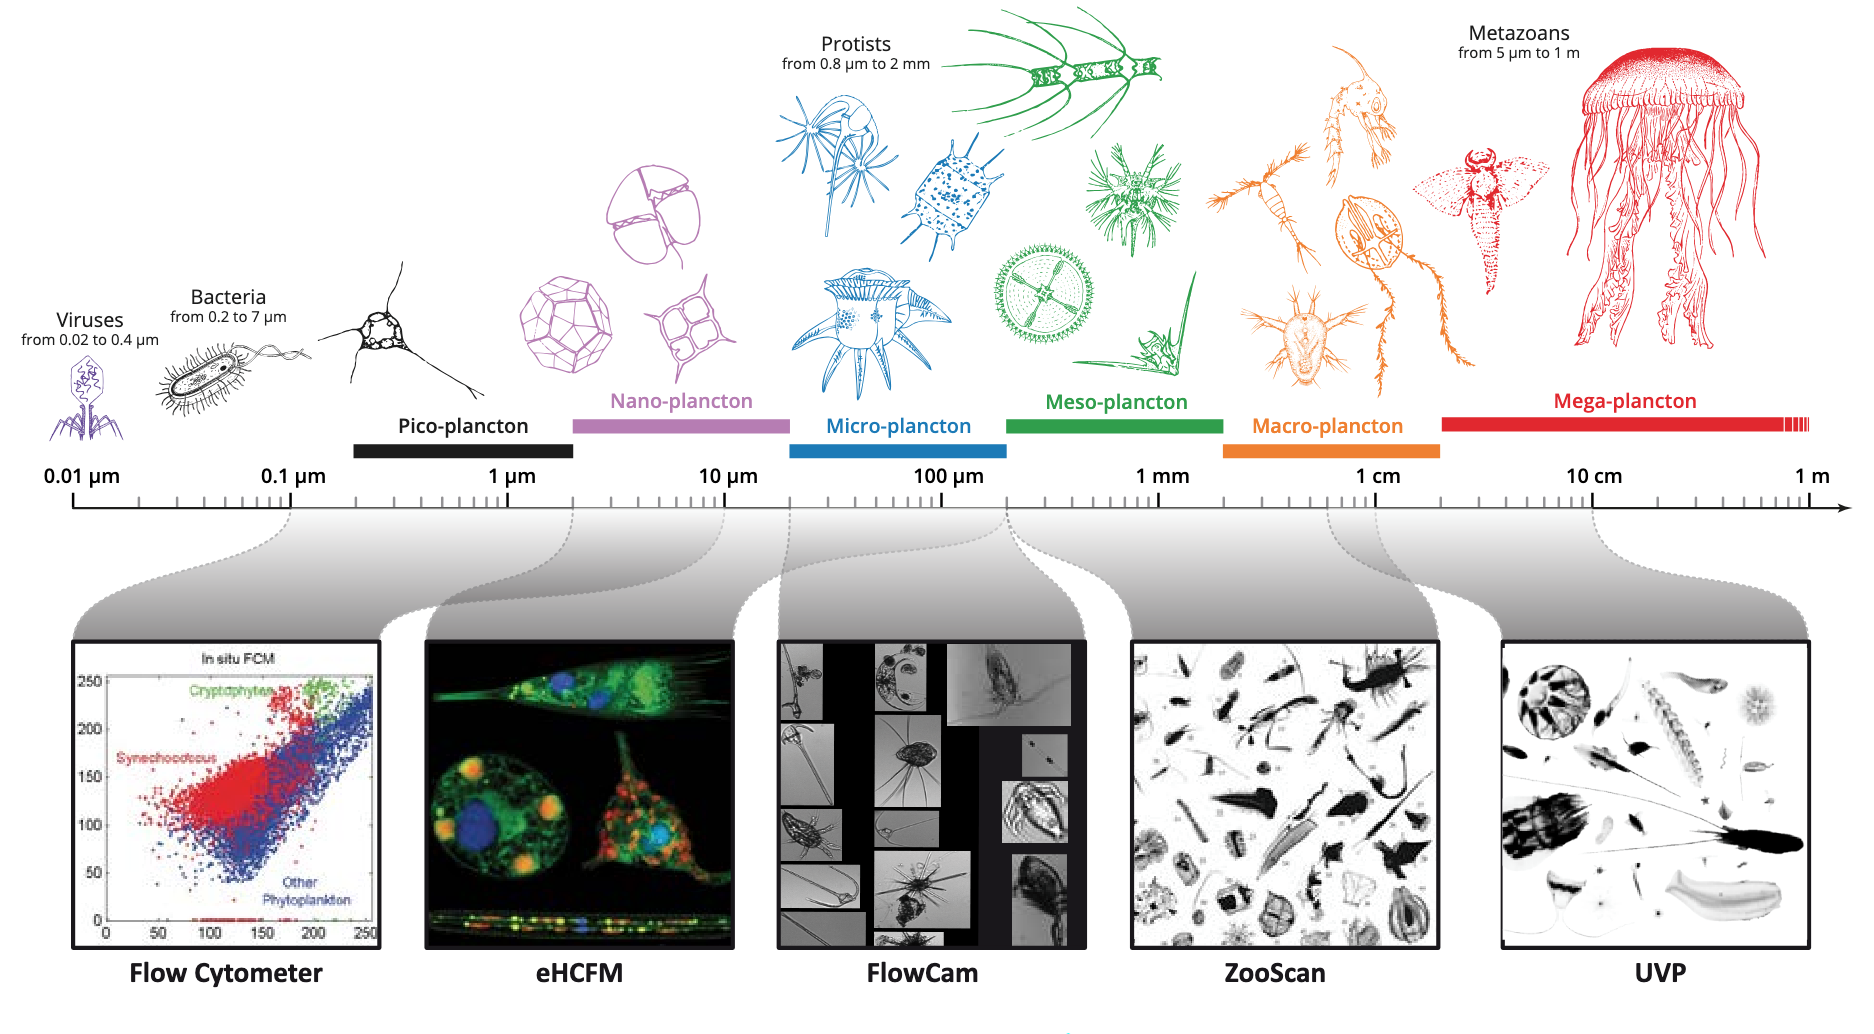
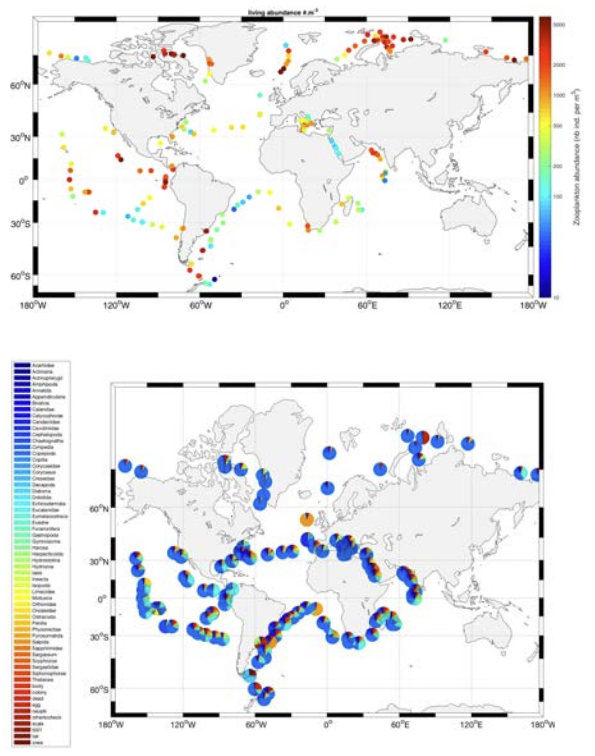
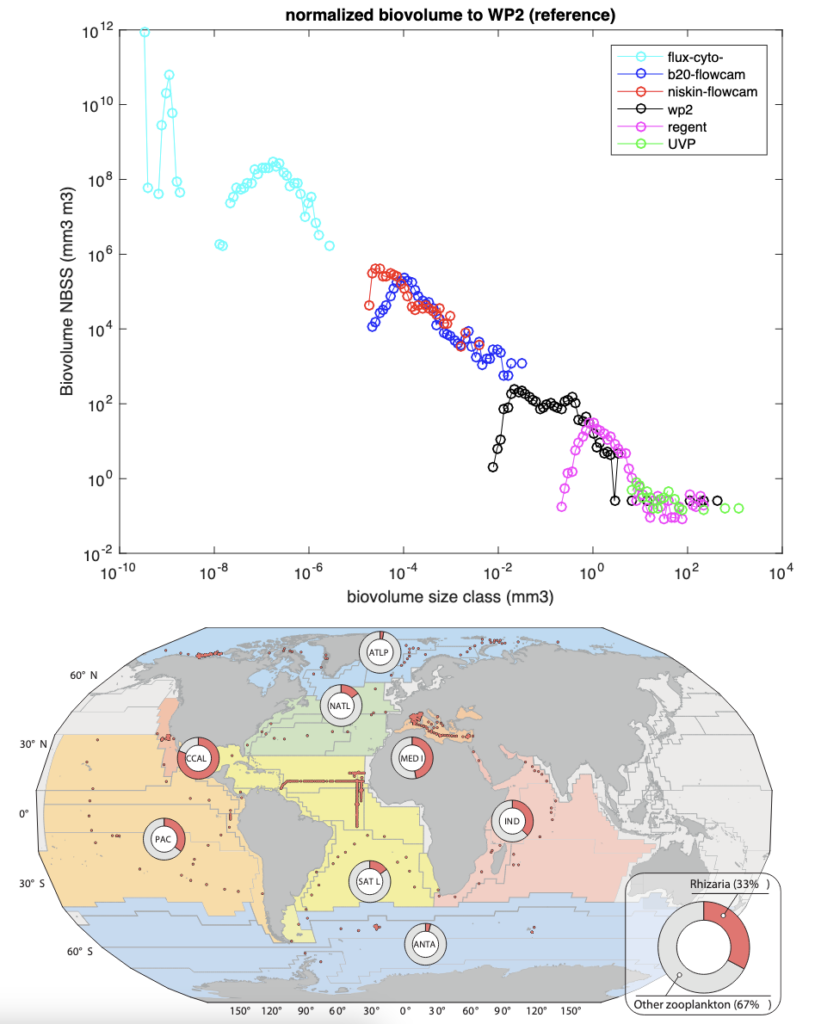
Figure 6. (following) Medium panels. Left: abundance (# of individual/m3) of total zooplankton from the WP2-net samples (200μm-1cm, Zooscan-data) in all Tara Oceans stations. Note the relatively high zooplankton abundance in polar and tropical upwelling ecosystems. Right: Example of a meta- plankton sample based on total plankton abundance data measured by Flow Cytometer, FlowCam (both total water and 20µm net samples), ZooScan (from 200 µm-WP2 and 680 µm-Regent nets samples), and UVP (in situ imaging), at a single station (here TO Polar Circle Station 168). It shows how the suite of imaging methods can be merged to provide a holistic and quantitative morphological view of a plankton community. Lower panels: Left: relative abundance of >60 taxonomic groups of zooplankton as measured by ZooScan on the Regent-net (680μm-1cm) samples, showing how metazoan diversity behaves along the Tara Oceans stations, with an overall dominance of copepods (in blue). Right: The dominance of copepods was challenged by the non-destructive view of meso/macro plankton provided by the UVP. Global UVP data (~700 profiles down to 500m depth here) show that giant protists (rhizaria) are more abundant than all metazoan plankton together in (sub)tropical biomes.