Key advances: temperature-structured biogeography, ocean microbial gene catalog, metabolic specialization
Marine bacteria and archaea dominate ocean biomass and drive global biogeochemical cycles. Tara Oceans generated the largest standardized ocean microbial sequencing dataset to date, comprising 47 million genes from around 35,000 taxa, and introduced new computational approaches to explore microbial diversity at planetary scale. Analyses revealed multiple distinct microbial species‑level lineages in the pelagic ocean, with community structure in surface waters strongly organized as a function of temperature (Tara Oceans publication numbers 22, 41, 94 and Figure 4).
The Ocean Microbial Reference Gene Catalogue (OMRGC), comprising tens of millions of non‑redundant genes, provided a foundational resource for studying microbial metabolism, evolution, and biogeography. Subsequent studies expanded these insights through genome‑resolved analyses, revealing metabolic specialization, adaptive strategies, and ecological niches across ocean basins and depths (Tara Oceans publication numbers 6, 39, 69, 130, 150).
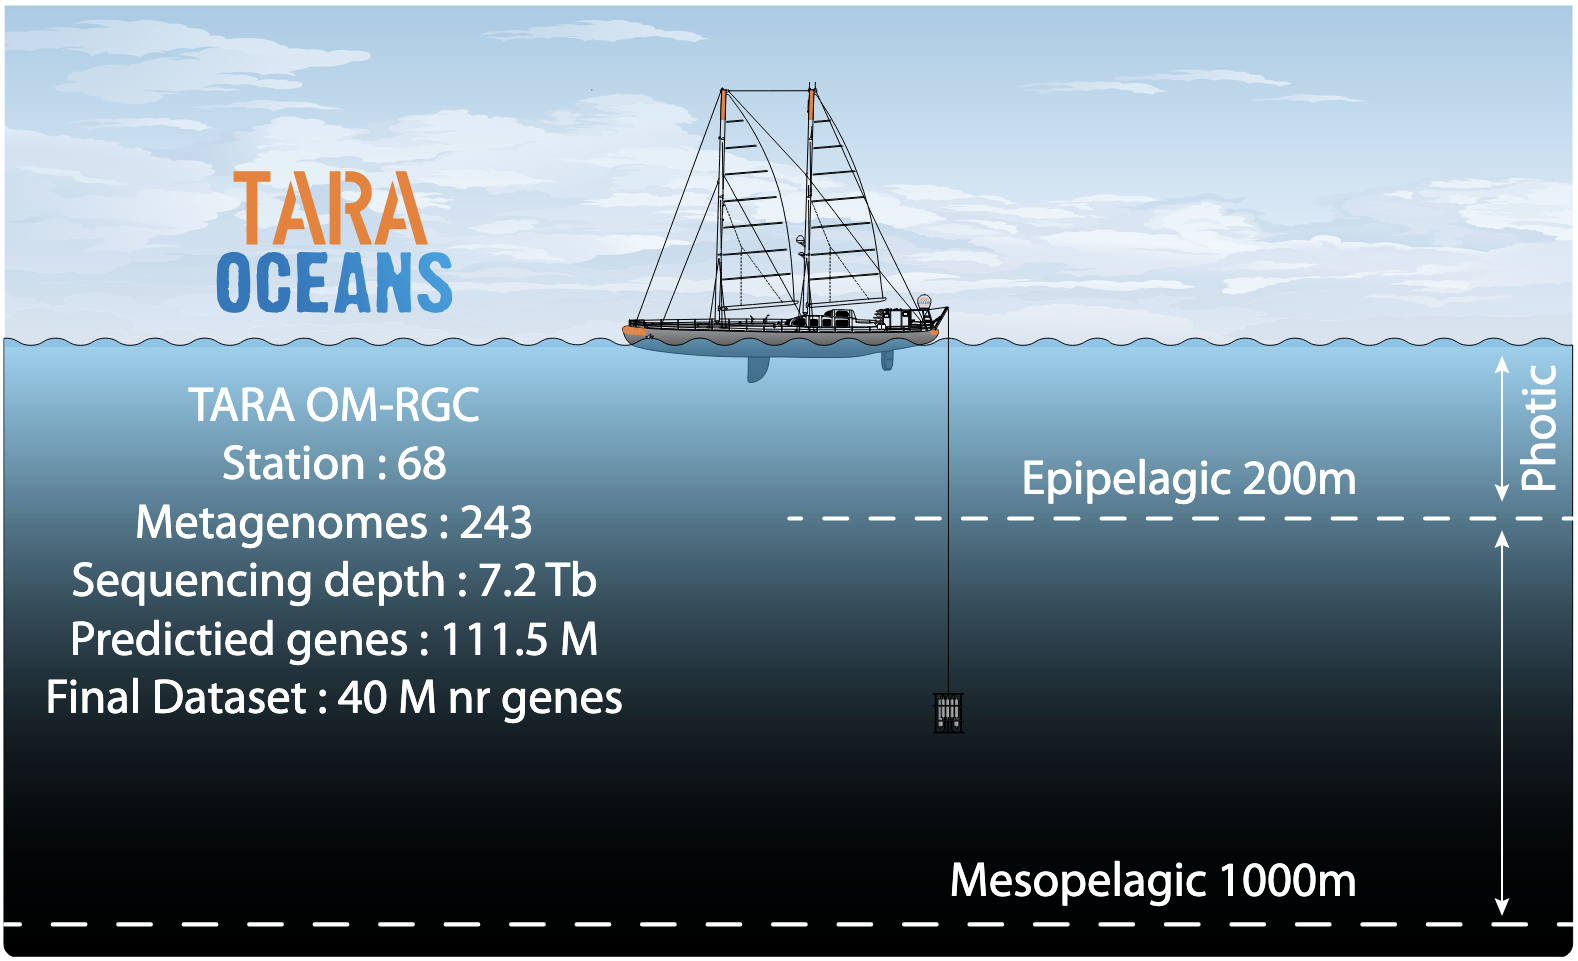
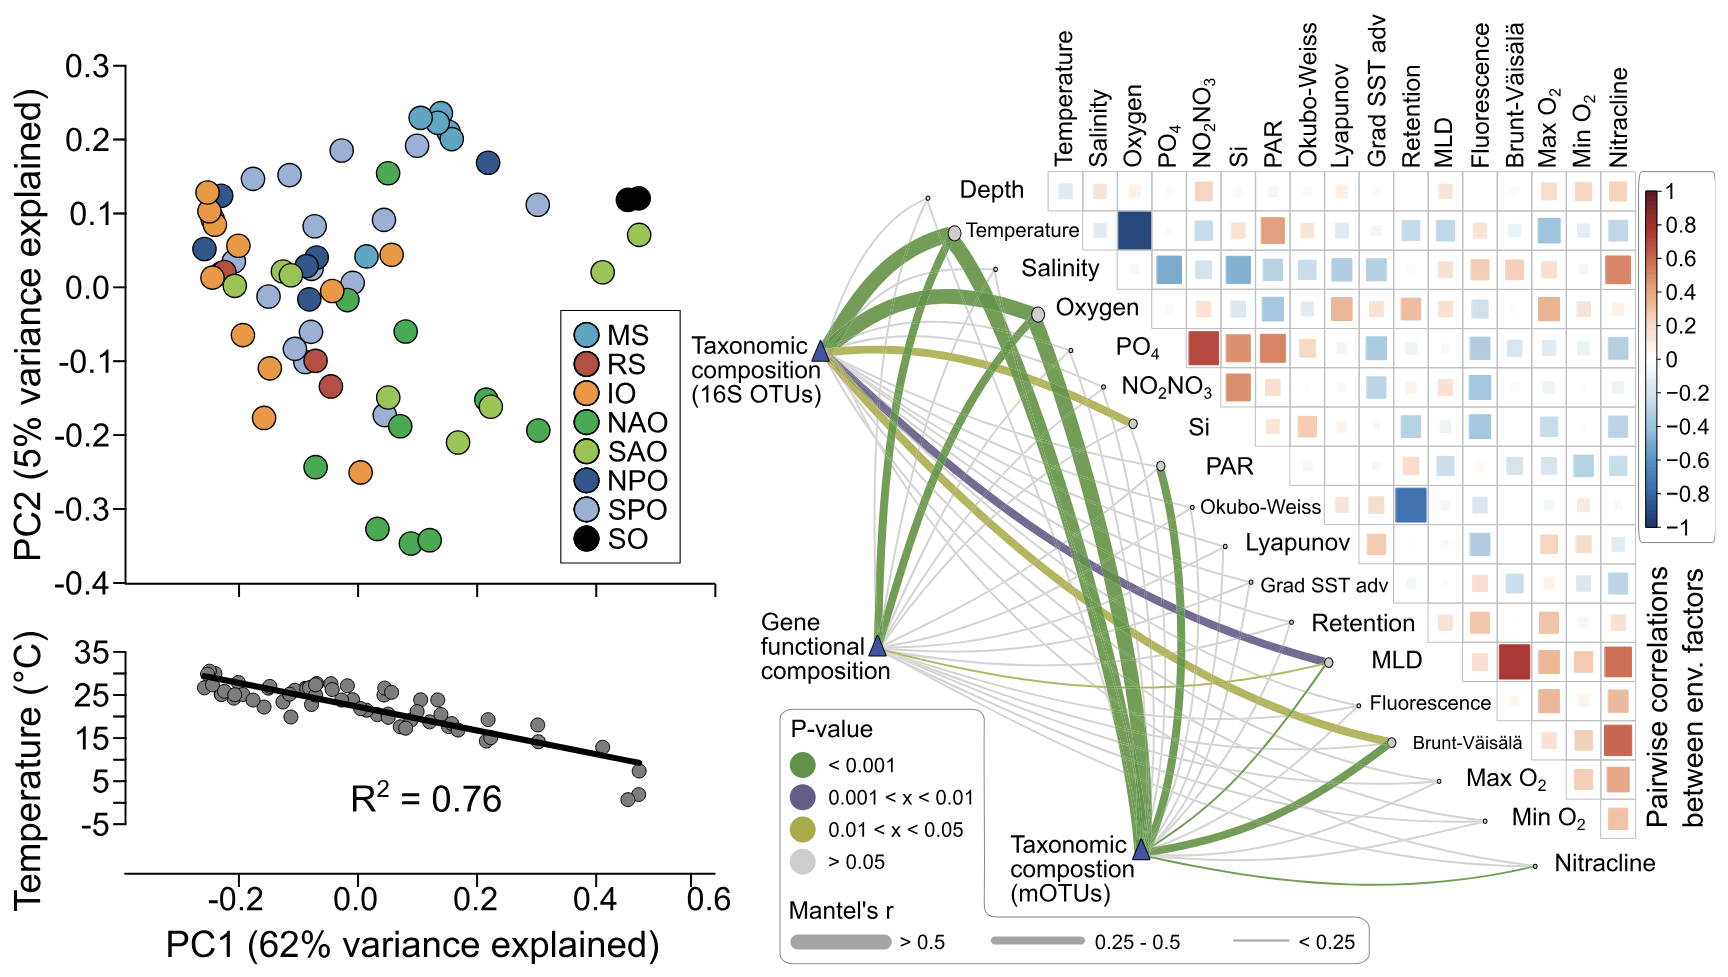
Figure 4. Upper panel: Numerical breakdown of the Ocean Microbial Reference Gene Catalog. The OM-RGC contains >40 million non-redundant genes from marine viruses, archaea, bacteria and picoeukaryotes sampled from 243 Tara Oceans (TO) metagenomes generated from a 1000 m depth layer of the world oceans. Lower panel: Use of TO prokaryotic ‘omics’ data to unveil environmental drivers of surface microbial community composition. The principal coordinate (PC) analysis shows that plankton communities are not clearly grouped by their geographic origin (top), but rather separated by the local temperatures (bottom: strong correlation between the first PC and temperature). On the right, correlations [green lines: geographic distance–corrected Mantel tests] of plankton taxonomic [two independent methods: miTags and mOTUs] and functional [biochemical KEGG modules] compositions to key environmental parameters. The environmental parameters are also compared between themselves, with a colour gradient denoting pairwise Spearman’s correlation coefficients. Edge width corresponds to the Mantel’s r statistic for the corresponding distance correlations, and edge colour denotes the statistical significance based on 9,999 permutations (Sunagawa et al. 2015).